Abl’s Research Backed College and Career Readiness Framework and Methodology
Steven Gering | August 18, 2023
Dr. Gering is a veteran educator, and former Chief Academic Officer for Spokane Public Schools. During his service in school districts, he was an award-winning principal, received the Golden Apple Award in Washington State, and presented at local and national conferences across the country.
After starting his career as a teacher and coach in Texas, he attended graduate school at Harvard and earned his doctorate from the University of Washington. He is currently a member of the School Success Team at Abl, where he helps district leaders to understand and consider how district decision-making impacts student experiences— and educational equity.

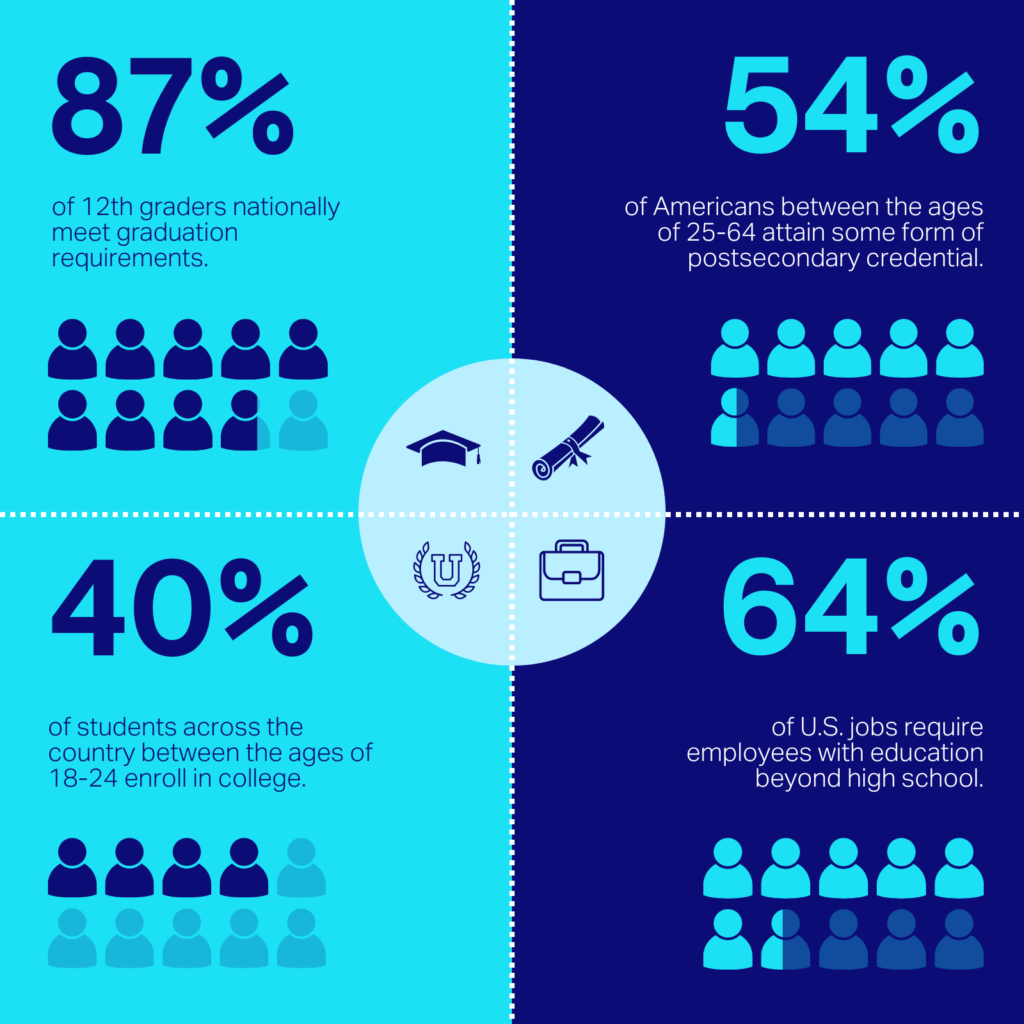
Economic forecasts prior to the COVID-19 pandemic predicted that 7 out of 10 jobs would require some form of postsecondary education by 2030.1Georgetown University Center on Education and the Workforce forecast using data from the U.S. Census Bureau and Bureau of Labor Statistics, Current Population Survey; U.S. Bureau of Labor Statistics; Macroeconomic Advisers LLC; and EMSI (formerly Economic Modeling Specialists International). While it is still too early to precisely predict what will happen in the short-term U.S. economy, evidence suggests that the combination of technology2Hershbein, Brad, and Lisa B. Kahn. “Do Recessions Accelerate Routine-Biased Technological Change? Evidence from Vacancy Postings.” American Economic Review vol. 108, no. 7, 2018, pp. 1737–72; Carnevale, Anthony P., Tamara Jayasundera, and Artem Gulish. America’s Divided Recovery: College Haves and Have-Nots. Georgetown University Center on Education and the Workforce, 2016, Washington, D.C. and economic forces3Carnevale, Anthony P., Nicole Smith, and Jeff Strohl. “Help Wanted: Projections of Jobs and Education Requirements through 2018.” Georgetown University Center on Education and the Workforce, 2010, Washington, D.C. will favor upskilling in the U.S. workforce. Overall, most of the evidence indicates that the fastest-growing occupations will require postsecondary education and that even midskilled occupations that traditionally have required lower levels of education to enter the workforce will require continued upskilling.4Carnevale, Anthony P, Jeff Strohl, Nicole Smith, Ban Cheah, Artem Gulish, and Kathryn Peltie. “Navigating the College to Career Pathway: The 10 Rules of Moving from Youth Dependency to Adult Economic Dependence.” Georgetown Center for Education and the Workforce, 2019, Washington, D.C.
Political leaders have widely recognized that to attract and retain businesses and sustain economic development, it is imperative to have an educated populace and for more adults to obtain credentials and degrees. Currently, however, there are wide disparities in educational attainment across the country.
These educational disparities are present across the following groups:
- Socioeconomic status: Students from the lowest quintile of socioeconomic status (SES) are 38% less likely to enroll in college than students from the highest quintiles.5Reber, Sarah and Ember Smith. “College Enrollment Disparities: Understanding the Role of Academic Preparation.” Brookings Center on Children and Families, 2023, Washington, D.C.
- Race and Ethnicity: Racial and ethnic disparities in attainment have followed similar patterns for decades with Asian or Pacific Islander adults most likely to have postsecondary degrees including bachelor’s degrees, followed by white, Black, Hispanic and Native American adults.6Reber, Sarah and Ember Smith. “College Enrollment Disparities: Understanding the Role of Academic Preparation.” Brookings Center on Children and Families, 2023, Washington, D.C., 7Cahalan, Margaret W., Marisha Addison, Nicole Brunt, Pooja R. Patel, Terry Vaughan III, Alysia Genao, and Laura W. Perna. “Indicators of Higher Education Equity in the United States: 2022 Historical Trend Report.” The Pell Institute for the Study of Opportunity in Higher Education, the Council for Opportunity in Education (COE), and Alliance for Higher Education and Democracy of the University of Pennsylvania (PennAHEAD), 2022, Washington, D.C.
- Gender: Women are more likely to obtain postsecondary degrees than men, and men are more likely to have a high school or GED diploma as their highest level of educational attainment.8U.S. Census Bureau. “Educational Attainment in the United States: 2021.” U.S. Census Bureau, 2022, Washington, D.C.
- Geographic: Eighteen to 24-year-old adults across the western U.S. and South, in general, have much lower rates of direct enrollment postsecondary educational enrollment than students who graduate high school from the Northeast and Midwest.9Cahalan, Margaret W., Marisha Addison, Nicole Brunt, Pooja R. Patel, Terry Vaughan III, Alysia Genao, and Laura W. Perna. “Indicators of Higher Education Equity in the United States: 2022 Historical Trend Report.” The Pell Institute for the Study of Opportunity in Higher Education, the Council for Opportunity in Education (COE), and Alliance for Higher Education and Democracy of the University of Pennsylvania (PennAHEAD), 2022, Washington, D.C.
Due to the large demand for an educated workforce — coupled with disparities in academic achievement — policymakers, educational organizations, and government entities remain interested in effective approaches to boost degree completion, enhance learning outcomes, and narrow outcome gaps between demographic groups.
By ensuring that students graduate high school prepared to thrive in their college and career pursuits, K-12 plays a critical role in meeting the demand for credentialed employees. However, traditional measures of postsecondary readiness don’t correlate to actual persistence. Toward that end, school districts need to have a comprehensive approach to assisting students and families in successfully preparing for and navigating the complex pathway to credentials, degrees, and postsecondary education. Fortunately, there is a large body of research pointing toward promising practices that district and school leaders can pursue to improve student outcomes in postsecondary education; these promising practices are outlined here.
Implications for K-12 Education
College and Career Readiness Framework
There is no single solution, or silver bullet, that can effectively address the educational gaps arising from differences in socioeconomic status, race and ethnicity, gender, and geography. Consequently, it is crucial to adopt a comprehensive approach and a well-defined framework for best practices in college and career readiness.
Numerous frameworks and approaches exist for measuring postsecondary readiness, and many of them share similar components. Abl has chosen a specific college readiness framework developed at the University of Chicago that consists of three key constructs: academic preparedness, academic tenacity, and college and career knowledge.10Long, Mark C., Dylan Conger, and Patrice Iatarola. “Effects of High School Course-Taking on Secondary and Postsecondary Success.” American Educational Research Journal, v49 n2 p285-322, 2012, Thousand Oaks, CA. In parallel, Abl developed a career readiness framework to holistically address postsecondary readiness.
It is also crucial to focus on postsecondary readiness as opposed to eligibility. Readiness ensures that students are sufficiently prepared to enroll and succeed in non-remedial, credit bearing general education coursework. When we focus on measuring and ensuring readiness, we provide all students with the best chance to succeed in their desired postsecondary pursuits.
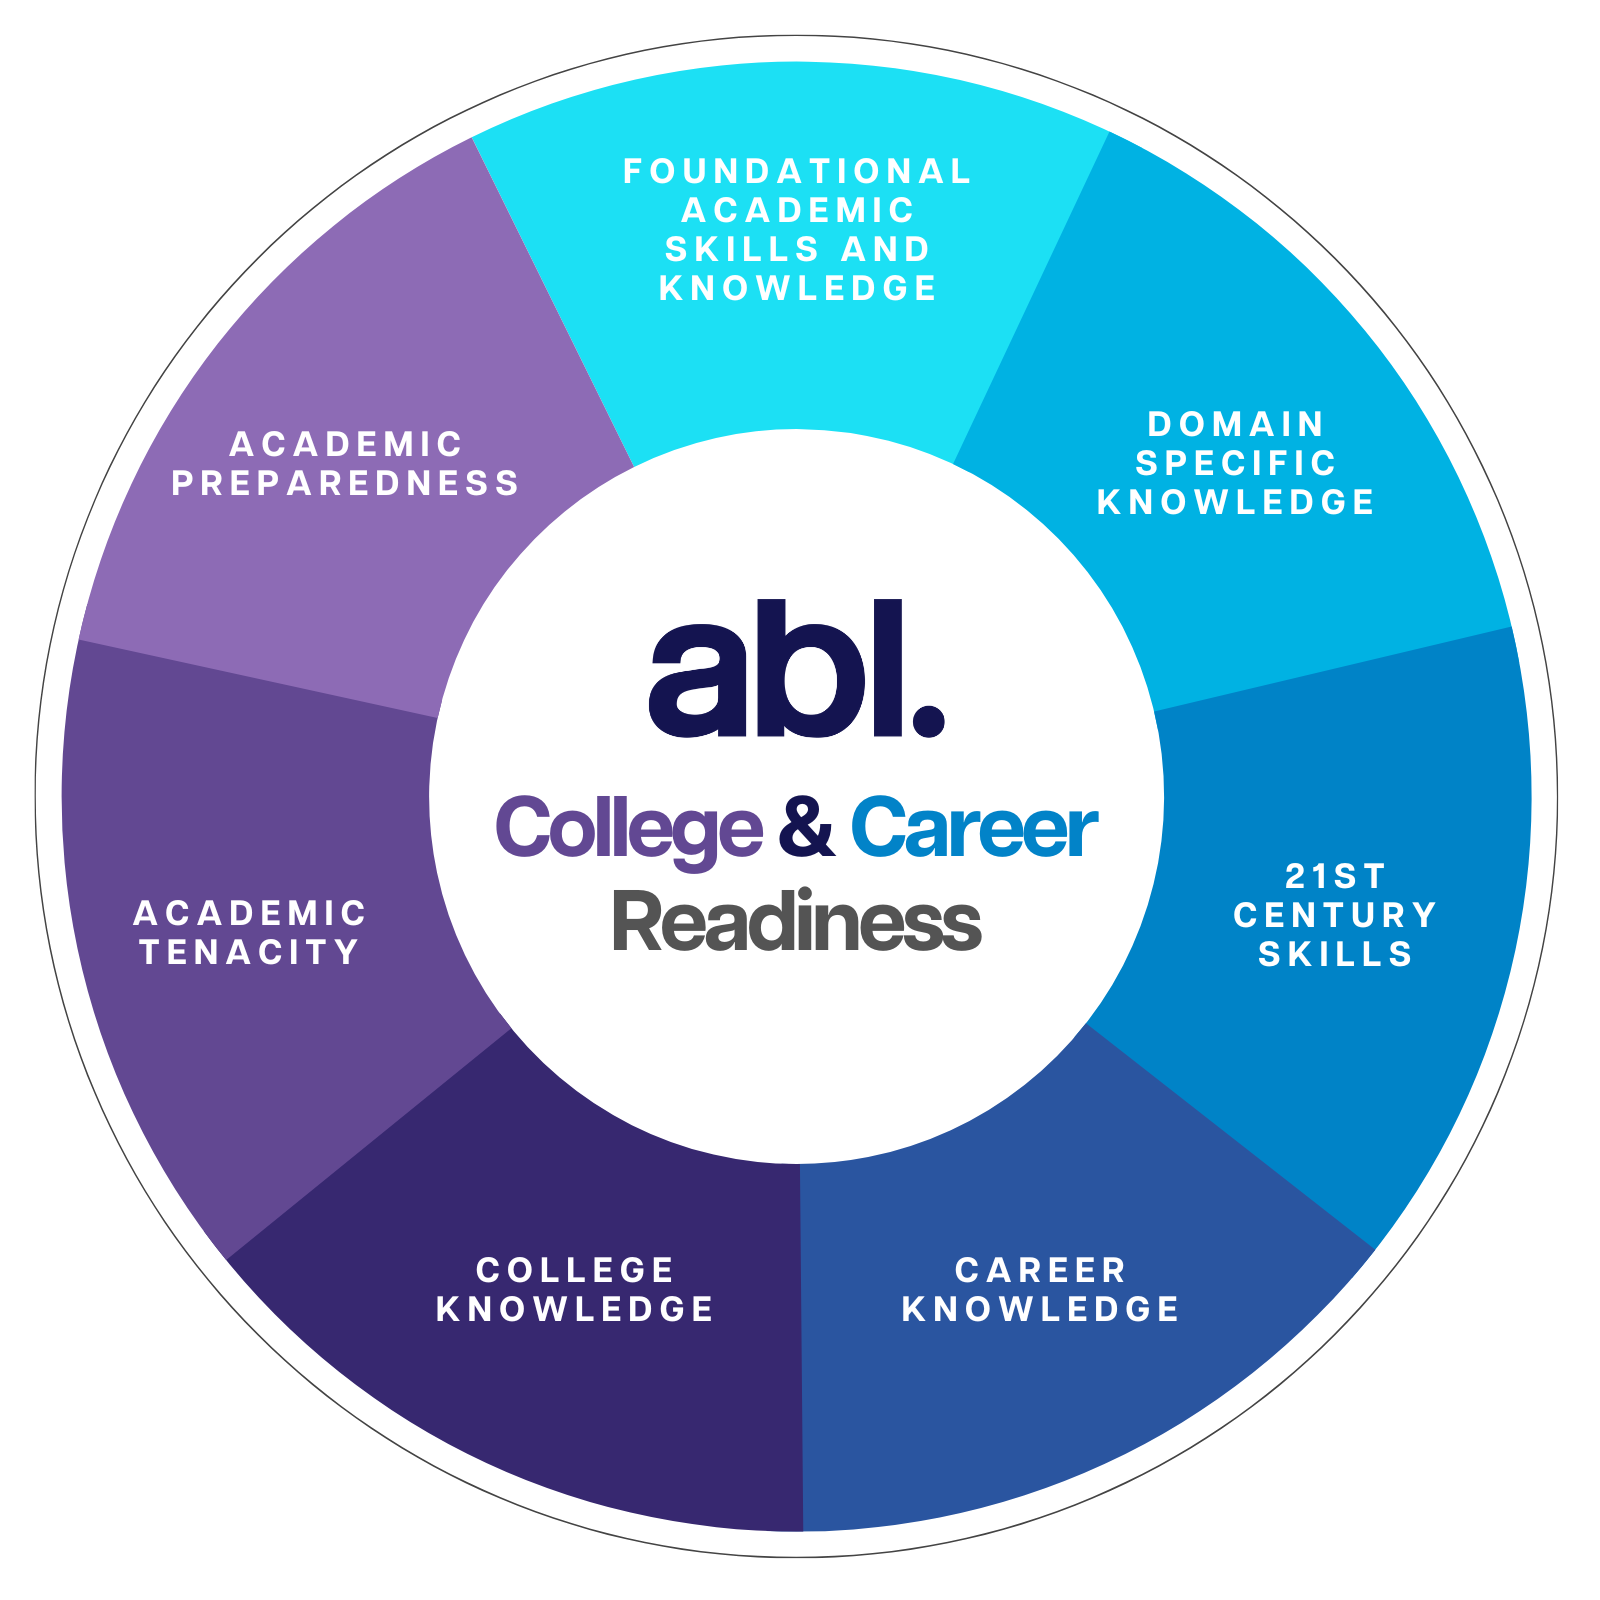
Abl’s College and Career Ready Framework
- Academic Preparedness: The key academic content knowledge and cognitive strategies needed to succeed in doing college-level work.
- Academic Tenacity: The underlying beliefs and attitudes that drive student achievement.
- College and Career Knowledge: The knowledge base and contextual skills that enable students to successfully access and navigate college and career pathways.
- Foundational Academic Skills and Knowledge: The underlying reading and mathematics knowledge and skills needed to succeed in their job training. The foundational academic skills and knowledge have increased significantly due to technological advances across all career fields.
- Domain Specific Knowledge: The job-relevant knowledge and skills that are necessary to perform the job duties and meet the job requirements. This knowledge is usually very specific to a particular career or career field.
- 21st Century Skills: The skills that students need to be successful in the modern economy. They include three groups of skills including learning skills, literacy skills, and life skills.
- Career Knowledge: The opportunities and knowledge about how to engage with and navigate the institutions and communities they will enter after high school. In other words, they need social capital.
These constructs, when addressed comprehensively, have proven track records of both improving postsecondary readiness indicators and outcomes and provide districts with a road map for best practice implementation and measurement.
Abl incorporates this framework into our professional development sessions and assists districts in identifying best practices associated with each of these constructs through consulting and our Library of Strategies.
Analysis of Academic Preparedness
When Abl began our research on college and career readiness indicators, one crucial focus emerged: academic preparedness. Several key reasons drove this emphasis.
First, extensive research had already highlighted the vital role of K-12 academic preparedness in shaping students’ postsecondary enrollment, persistence, and degree completion. While it might not single-handedly address all educational inequities, it was undeniably one of the most predictive factors. The K-12 system had a significant opportunity to positively influence students’ outcomes in this aspect.
Second, a notable gap existed in tools and resources for K-12 systems to effectively measure student academic preparedness using robust methods. Many existing metrics and indicators relied on easy-to-obtain data but often fell short in their predictive accuracy. In fact, some of the accountability measures in place across the nation showed little or no correlation with college and career readiness.
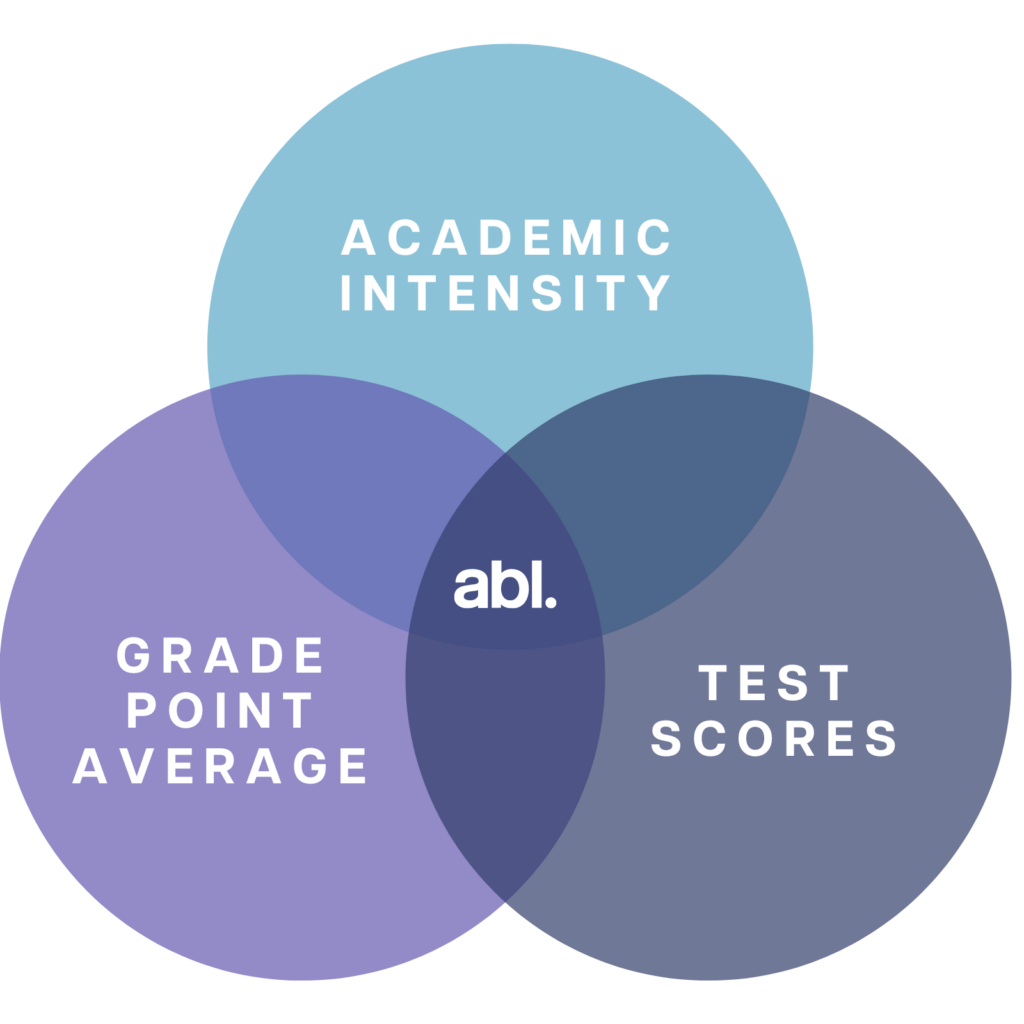
During its comprehensive literature review, Abl discovered that the best methods for measuring academic preparedness involved using multiple data points instead of relying solely on one metric for such a complex concept. The most common indicators used in practice, like test scores and GPAs, were traditional measures for college admission. However, the research also consistently highlighted the importance of another indicator: academic intensity. Over multiple decades, academic intensity emerged as one of the most significant predictors of postsecondary momentum and degree completion.11Annenberg Institute for School Reform, Brown University; John W. Gardner Center for Youth and their Communities, Stanford University; & University of Chicago Consortium on Chicago School Research. “Beyond college eligibility: A new framework for promoting college readiness. College Readiness Indicator Systems Resource Series.” Bill & Melinda Gates Foundation, 2014, Seattle, WA., 12Adelman, Clifford. “Answers in the Tool Box: Academic Intensity, Attendance Patterns, and Bachelor’s Degree Attainment.” National Institution on Postsecondary Education, Libraries, and Lifelong Learning, 1999, Washington, D.C., 13Morgan, Lee. “From High School Access to Postsecondary Success: An Exploratory Study of the Impact of High-Rigor Coursework.” Education Sciences 2018, Basel, Switzerland. 14Adelman, Clifford. “The Toolbox Revisited: Paths to Degree Completion from High School Through College.” U.S. Department of Education — Office of Vocational and Adult Education, 2006, Washington, D.C.
Abl built on this research and developed scalable processes to combine three of the most predictive academic preparedness indicators together — course intensity, GPA, and test scores15Anderson, Lexi and Mark Fulton. “Multiple Measures for College Readiness.” Education Commission of the States, 2015, Denver, CO. — to produce an exceedingly accurate and actionable measure of college readiness. Among these three indicators, course intensity and GPAs were identified as the most predictive factors.16Wiley, Andrew, Jeffrey Wyatt, and Wayne J. Camera. “The Development of a Multidimensional College Readiness Index.” College Board, 2011, New York, NY.
Abl’s Multidimensional Analysis
As mentioned earlier, test scores and GPAs are easily accessible and measurable. However, quantifying course intensity, especially when considering the entire body of student course-taking, is a more intricate task. Abl chose to replicate a study and methodology that evaluated student course completion holistically.17Wiley, Andrew, Jeffrey Wyatt, and Wayne J. Camera. “The Development of a Multidimensional College Readiness Index.” College Board, 2011, New York, NY. This original study was remarkable because it combined measures of course intensity with GPA and test scores, resulting in highly predictive indicators of student college readiness, as demonstrated by their freshman year GPA. Students who met the benchmarks of academic preparedness had a 67% chance of achieving a freshman year GPA of 2.67 or higher. Notably, this study derived its findings empirically from actual college success and readiness, using measures based on students’ actual achievements.
Additionally, this method of assessing course intensity closely resembled the holistic evaluations of student course-taking patterns that many college admission representatives throughout the U.S. conducted.18 Coleman, Arthur L. & Jamie Lewis Keith. “Understanding Holistic Review in Higher Education Admissions: Guiding Principles and Model Illustrations.” College Board and EducationCounsel, 2018, New York, NY.
However, despite the significance of the original study, measuring student course-taking patterns or intensity within K-12 presented challenges. The study relied solely on student survey data and postsecondary data, making it difficult to replicate or utilize for K-12 school districts. To address this limitation, Abl took on the ambitious task of using actual student transcript records to measure and quantify student course intensity. Our methodology involves gathering all student course-taking history from participating school districts, including course titles, grades, and test scores. We then conduct a thorough review of all courses, code them appropriately, and apply meta coding to analyze trends and patterns in the course data.
The resulting comprehensive analysis is unique and provides districts with insight into several crucial aspects of student course-taking patterns:
- Persistence: An analysis of how many years of postsecondary preparatory coursework students are completing in math, science, social studies, English, and world languages.
- Advanced Coursework: An analysis of the number and subjects in which students complete advanced coursework such as honors, dual credit, college in the high school, and Advanced Placement or International Baccalaureate coursework
- STEM progressions: An analysis of the highest level of math coursework that is completed and specific science sequences (e.g., biology, chemistry, and physics) that are highly indicative of postsecondary success.
This analysis enables districts to gain a comprehensive understanding of the intensity of the overall body of coursework that all students are completing (Academic Intensity Measure), how they navigate through course offerings, the impact of guidance and advising systems on academic journeys, and students’ overall readiness for college and career.
Schools and districts working with Abl to conduct a student journey and educational opportunity analysis receive the following data analytics:
- Student multidimensional college readiness including detailed breakdowns of course intensity, GPA, and test scores.
- Course intensity profiles of student groups including readiness (momentum) for postsecondary success in a range of postsecondary pathways.
- Detailed analysis of each subject area including persistence data, advanced coursework, and equity data.
- Comprehensive career readiness course-taking data analytics.
This cutting-edge analysis has been designed in collaboration with educators, equipping school and district leaders with the necessary tools to act on their data and improve student college and career readiness outcomes.