Breaking Down Barriers
A Multiphase Approach to Transforming Your Scheduling Practices and Unlocking Lifelong Opportunity for Students
Steven Gering, EdD and Wendy Watson, EdD
Phase 1: Analysis and Goal Setting
“At the state and local levels, annually review the extent to which a rigorous and engaging curriculum is provided across K-12 schools and to what degree all students have access to this kind of curriculum, including advanced mathematics and science courses.” 1
Leung, Melanie, Jessica Cardichon, Caitlin Scott, and Linda Darling-Hammond. “Inequitable Opportunity to Learn: Access to Advanced Mathematics and Science Courses.” Learning Policy Institute, 2020, Washington, DC.
Using Heifeitz and Linsky’s analogy, the school schedule is not like a car that a mechanic can simply fix. Yes, it requires highly technical expertise to fine-tune and maximize its performance. However, the schedule provides a much larger opportunity to truly maximize impact that requires adaptive leadership.
One of the most important aspects of strategic scheduling is having a full understanding of how current practices impact student outcomes. That analysis involves multiple key components:
- Monitoring students beyond high school.
- Understanding the research base associated with strategic scheduling.
- Tracking key indicators and metrics using predictive analytics.
- Action planning and progress monitoring.
Monitoring Students Beyond High School
Over the last decade there has been a national focus on improving high school graduation rates which has resulted in noteworthy gains.
In the 2018-19 school year, the national adjusted cohort graduation rate (ACGR) for public high school students was 87%, the highest it has been since the rate was first measured in 2010-11. Asian/Pacific Islander students had the highest ACGR (93%), followed by White (90%), Hispanic (83%), Black (81%), and American Indian/Alaska Native (75%) students.2National Center for Education Statistics. “Public High School Graduation Rates: Condition of Education.” U.S. Department of Education Institute of Education Sciences, 2023, retrieved 9/26/2023 from https://nces.ed.gov/programs/coe/indicator/coi/high-school-graduation-rates.
That is a notable achievement, and the efforts by educators across the country should be credited for their intentional work to improve high school graduation rates. However, there is concern that the singular focus on improving high school graduation has resulted in erosion of the high school diploma’s meaning and quality.3
Almond, Monica, Robyn Harper, Francisco Jaimes, Liz Spurgeon, & Sean Bradley. “Paper Thin: Why All High School Diplomas Are Not Created Equal.” Alliance for Excellent Education, 2017, Washington, DC.
With two-thirds of new jobs requiring some advanced training, degree, or credential, it is important to ensure that students not only matriculate but also succeed in their postsecondary pursuits.4Georgetown University Center on Education and the Workforce forecast using data from the US Census Bureau and Bureau of Labor Statistics, Current Population Survey; US Bureau of Labor Statistics; Macroeconomic Advisers LLC; and EMSI (formerly Economic Modeling Specialists International). Most districts ask students what their postsecondary plans and intentions are before graduation, but few use data to monitor students in those pursuits. District and school leaders can use a number of methods to track key metrics of their graduates’ postsecondary success. One common method is subscribing to the National Student Clearinghouse Student Tracker for High Schools which enables leaders to ascertain three aspects of student postsecondary success (see Table #3).5National Student Clearinghouse. (2022). About Our Data. Retrieved 5/14/23, from https://www.studentclearinghouse.org/dei-data-lab/about/about-our-data/.
Table #3: Key Metrics to Track When Measuring Postsecondary Success
A list of the key metrics and data points that every district and school should be tracking for all graduates.
POSTSECONDARY DIRECT ENROLLMENT
Importance
For historically underserved scholars, the longer they wait to enroll in postsecondary education, the less likely they are to enroll and complete a degree or credential.6
Nagaoka, Jenny, Jee Sun Lee, Alexandra Usher, and Alex Seeskin. “Navigating the Maze: Understanding CPS Graduates’ Paths through College – Research Report.” University of Chicago Consortium on School Research, 2021, Chicago, IL. 7Bozick, Robert, Stefanie DeLuca. “Better Late Than Never? Delayed Enrollment in the High School to College Transition.” University of North Carolina Press, Volume 84 No. 1, 2005, Chapel Hill, NC.
Common K-12 Mistake
Assuming graduates’ stated intentions about their postsecondary enrollment plans will result in actual enrollment — across the country, 10%-40% of seemingly college-intending students, particularly those from low-income backgrounds, fail to enroll in college the fall after graduation.8Strategic Data Project. “Summer Melt Tools.” Center for Education Policy Research Harvard University, retrieved 9/26/23 from https://sdp.cepr.harvard.edu/summer-melt-tools.
POSTSECONDARY PERSISTENCE
Importance
If scholars do not return for a second year of their postsecondary studies, that could implicate a lack of academic preparation or adequate guidance during their secondary education.
Common K-12 Mistake
Ignoring this data when evaluating the district’s curriculum rigor and quality as well as how students are being advised.
POSTSECONDARY DIRECT COMPLETION
Importance
Degree completion is a powerful indicator of scholars’ postsecondary momentum.
Common K-12 Mistake
Not utilizing data on postsecondary completion rates to evaluate K-12 program quality and alignment — such as career and technical education pathways and quality of core coursework.
Leaders can also gather data from surveys, social media, community colleges, and apprenticeship programs to follow up with graduates and ensure students are successful in their pursuits after leaving the K-12 school system. The key idea is that leaders should actively gather data on scholars’ postsecondary trajectories and use that as one of many indicators of student success.
Understanding the Research Base Associated With Strategic Scheduling
CORE COURSEWORK
Among the various K-12 indicators that have a significant impact on students’ postsecondary enrollment and success, student enrollment in intense core coursework stands out as exceptionally important. Schools should advise all scholars to complete an intense pattern of core courses as part of their academic programming, because all students — regardless of their postsecondary aspirations and plans — benefit from completing an intense academic journey.9Horn, L. and C. Dennis Carroll. “High School Academic Curriculum and the Persistence Path Through College: Persistence and Transfer Behavior of Undergraduates 3 Years After Entering 4-Year Institutions.” National Center for Education Statistics, August 2001, Washington, D.C.
When educators hear the term “course intensity,” it often conjures up images of college preparatory coursework such as Advanced Placement (AP) or International Baccalaureate (IB). Having students enroll in additional years of advanced coursework such as AP is one method of improving intensity. However, students can improve their overall intensity by completing an additional year of coursework beyond minimum requirements, such as taking a third or fourth year of a world language or an additional year of math, science, or social studies.10
Horn, L. and C. Dennis Carroll. “High School Academic Curriculum and the Persistence Path Through College: Persistence and Transfer Behavior of Undergraduates 3 Years After Entering 4-Year Institutions.” National Center for Education Statistics, August 2001, Washington, D.C. Maximizing enrollment in core coursework can dramatically improve course intensity and the scholars’ CCR.
Scholars can improve their course intensity in the following ways:
- Persistence: Successful competition of additional years of core coursework.
- Advanced coursework: Completion of honors;11
Wiley, Andrew, Jeffrey Wyatt and Wayne J. Camara. “The Development of a Multidimensional College Readiness Index.” College Board, 2011, New York, NY. dual credit;12Speroni, Cecilia. “Determinants of Students’ Success The Role of Advanced Placement and Dual Enrollment Programs.” National Center for Postsecondary Research, 2011, Washington, DC. concurrent enrollment; and AP, IB, or Cambridge coursework.13Bowers, Diana and Virginia P. Foley. “Advanced Placement and Dual Enrollment as Related to College Readiness and Retention at a Tennessee University.” Journal of Academic Administration in Higher Education, v14 n1 p5-10, 2018, Martin, TN. 14College Board. “New Analysis of AP Scores 1 and 2.” College Board, 2021, New York, NY. 15Beard, Jonathan J, Julian Hsu, Maureen Ewing, and Kelly E. Godfrey. “Studying the Relationships Between the Number of AP’s, AP Performance, and College Outcomes.” National Council of Measurement in Education, 2019, Mt. Royal, NJ. - STEM subjects: Take a fourth year of math and science and focus on the highest level of mathematics curriculum possible,16
Wainstein, Leonard, Carrie E. Miller, Meredith Phillips, Kyo Yamashiro, and Tatiana Melguizo. “Twelfth Grade Math and College Access.” Los Angeles Education Research Institute, 2023, Los Angeles, CA. along with rigorous science sequences (e.g., biology, chemistry, and physics).17Sadler, Philip M. and Robert Tai. “Success in Introductory College Physics: The Role of High School Preparation.” John Wiley & Sons, Inc. Sci. Ed. 85: 111-136, 2001, Hoboken, NJ.
CAREER AND TECHNICAL EDUCATION (CTE) COURSEWORK
Research on CTE coursework indicates it can be a powerful addition to the curricular offerings. Students can benefit from completing a rigorous core curriculum supplemented, but not replaced with, high-quality CTE coursework.18Steedle, Jeffrey, Justine Radunzel, and Krista Mattern. “Understanding the Preparation Levels Necessary for Different Postsecondary Pathways: A Rigorous Foundation is Critical for All.” ACT Research & Policy: Data Byte, 2019, Iowa City, IA. 19Achieve. “Ready or Not: Creating a High School Diploma that Counts.” American Diploma Project, 2004, Washington, DC.Comprehensive, high-quality CTE programs and curriculum have the following characteristics:
- Offer broad exploration of CTE pathways in middle school.20Field, Kelly. “The Path to a Career Could Start in Middle School.” The Hechinger Report, 2022, downloaded on 9/27/23 from https://hechingerreport.org/the-path-to-a-career-could-start-in-middle-school/. 21Association for Career and Technical Education. “Career Exploration in Middle School: Setting Students on the Path to Success.” ACTE, downloaded on 9/27/23 from https://www.acteonline.org/wp-content/uploads/2018/02/ACTE_CC_Paper_FINAL.pdf.
- Integrate rigorous academics throughout the CTE curriculum.22National Center for College and Career. “Pathway Framework.” ConnectED, 2021, Berkeley, CA. 23Suffren, Quentin and Danielle Mezera. “Putting Career and Technical Education to Work for Students: A Playbook for State Policymakers.” ExcelinEd, 2017, Tallahassee, FL.
- Provide students with opportunities to pursue depth in CTE curriculum.24The National Center for College and Career. “Pathway Framework.” ConnectED, September 2021, Berkeley, CA. 25Kreisman, Daniel M and Kevin Stange. “Vocational and Career Tech Education in American High Schools: The Value of Depth Over Breadth.” Education Finance and Policy, MIT Press, vol. 15(1), pages 11-44, Winter.
- Embed, when possible, meaningful certifications in the curriculum but not at the expense of the rigorous core/CTE curriculum.26
Southern Regional Education Board. “Credentials for All: An Imperative for SREB States.” SREB Commission on Career and Technical Education, 2015, Atlanta, GA. - Provide students with the opportunity to conduct work-based learning experiences tied to their pathway.27
Spaulding, Shayne and Madeleine Siros. “Designing Career and Technical Education Programs that Help Students Get Good Jobs.” Urban Institute, 2022, Washington, DC. 28Southern Regional Educational Board. “Partnership to Align Education and Careers.” SREB, 2020, Atlanta, GA. - Create opportunities for all students to earn meaningful dual-credit coursework as a curriculum path.29Rodriguez, Olga, Katherine L. Hughes, and Clive Belfield. “Bridging College and Careers: Using Dual Enrollment to Enhance Career and Technical Education Pathways.” 30Pyle, Karen. “CTE Dual Credit Participation and Postsecondary Outcomes in Washington: A Descriptive Analysis Using Data from the Statewide Enrollment and Reporting System.” Education Research and Data Center, 2023, Olympia, WA.
Tracking Key Indicators and Metrics Using Predictive Analytics
Once leaders understand the research base regarding the most important key indicators and metrics to monitor, then it is important for them to track those indicators in their own data. The three key indicators associated with strategic scheduling are the following:
- Course intensity: Are scholars completing an overall pattern of coursework that is predictive of their postsecondary success and momentum?
- Cumulative high school GPA: Are scholars graduating with the academic skill set to manage the challenges and rigor associated with postsecondary studies and career success?31Reber, Sarah and Ember Smith. “College Enrollment Disparities: Understanding the Role of Academic Preparation.” Brookings Center on Children and Families, January 2023, Washington. D.C. 32Hodara, Michelle and Monica Cox. “Developmental Education and College Readiness at the University of Alaska.” National Center for Education Evaluation and Regional Assistance, May 2016, Eugene, OR. 33Allensworth, Elaine M. and Kallie Clark. “High School GPA’s and ACT Scores as Predictors of College Completion: Examining Assumptions About Consistency Across High Schools.” American Education Research Association, January 2020, Washington, DC. 34Geiser, Saul and Maria Veronica Santelices. “Validity of High-School Grades in Predicting Student Success Beyond The Freshmen Year: High-School Record vs. Standardized Tests as Indicators of Four-Year College Outcomes.” Center for Studies in Higher Education, June 2007, Berkeley, CA.
- Test scores: Are scholars demonstrating a strong academic foundation predictive of postsecondary success? Is coursework rigorous, and are students learning the written and taught curriculum?35
Marini, Jessica P., Paul A. Westrick, and Emily J. Shaw. “Examining the Stability of SAT Predictive Relationships Across Cohorts and Over Time.” College Board, June 2021, New York, NY. 36Cho, YoungWoo, Jeffrey Steedle, David Woodruff, and Dean Colton. “The Validity of Low ACT Scores.” ACT Research & Policy, September 2020, Iowa City, IA. 37Westrick, Paul A., Jessica P. Marini, Emily J . Shaw. “An Updated Look at SAT Score Relationships with College Degree Completion.” College Board, June 2022, New York, NY.
Action Planning, Goal Setting, & Progress Monitoring
Tracking key indicators and metrics is insufficient without taking action, but when data is transformed into targeted actionable strategies, it can lead to effective solutions. Figure #3 illustrates Abl’s Theory of Action. District and school teams seeking to leverage data for meaningful change can also apply this approach regarding any school improvement effort.
Figure #3: Abl’s Theory of Action
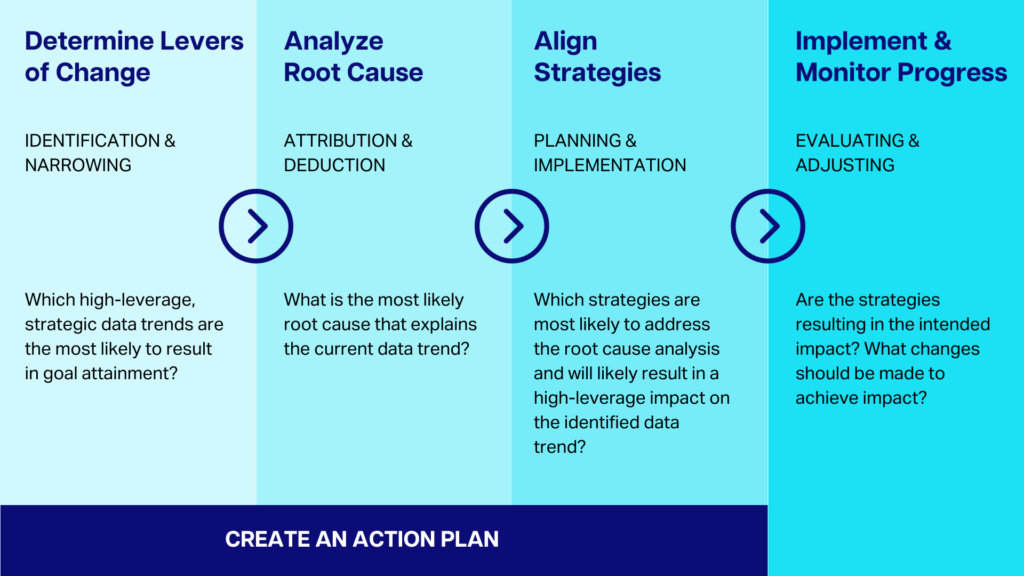
1.
Determine Levers of Change
Identification & Narrowing
Which high-leverage, strategic data trends are the most likely to result in goal attainment?
2.
Analyze Root Cause
Attribution & Deduction
What is the most likely root cause that explains the current data trend?
3.
Align Strategies
Planning & Implementation
Which strategies are most likely to address the root cause analysis and will likely result in a high-leverage impact on the identified data trend?
4.
Implement and Monitor
Evaluating & Adjusting
Are the strategies resulting in the intended impact? What changes should be made to achieve impact?
After the team identifies major data trends, it is important to identify key areas within the data that the team believes will have the greatest impact on the desired goals. The second step requires the team to analyze the root cause (see Table #4 below for sample data tied to strategic scheduling). This process involves the team reflecting on the data and what root causes are the most likely explanation for the student outcome data trends. At times, this process can require the team to gather additional data and engage with stakeholder groups to properly ascertain the root cause that best explains the data.
Table #4: Examples of Root Causes Related to Strategic Scheduling
Sample data trends, sources of additional data exploration, and root cause analysis associated with yearly analysis of strategic scheduling data.
IDENTIFIED DATA TREND #1
A small percentage (29%) of the student population complete an overall body of coursework predictive of postsecondary readiness.
ADDITIONAL DATA EXPLORATION
Suspecting low levels of a college and career mindset among students and staff, the data team conducted student and staff surveys developed by external survey specialists that verified their hypothesis.
ROOT CAUSE ANALYSIS
There are low levels of overall CCR mindset among students and staff.
ABL DATA VISUALIZATION
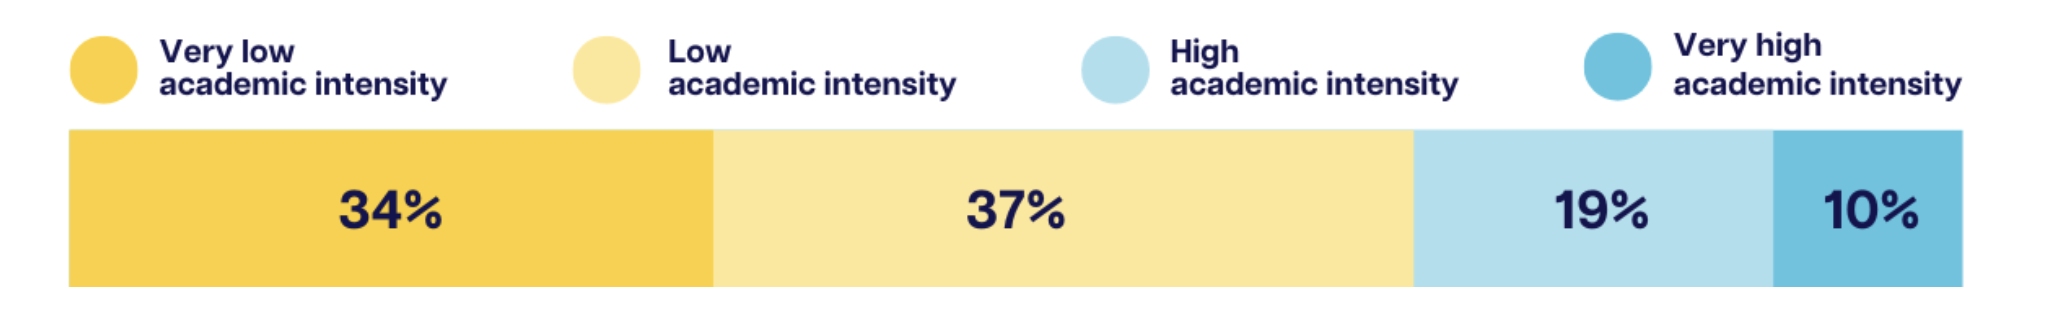
Table #4 continued
IDENTIFIED DATA TREND #2
Over multiple years, low percentages of students completing Algebra II were enrolling in precalculus or statistics. That trend lowered enrollment in calculus and overall math course intensity.
ADDITIONAL DATA EXPLORATION
School leaders met with the math department, counselors, and students to gather additional data. The consensus feedback indicated the jump between Algebra II and precalculus was too difficult. Students reported feeling overwhelmed and not prepared, and they often dropped the course in the first month of the school year. Staff members stated that the initial precalculus curriculum focused on content not currently taught in the Algebra II curriculum.
ROOT CAUSE ANALYSIS
There is a lack of curricular alignment.
ABL DATA VISUALIZATION
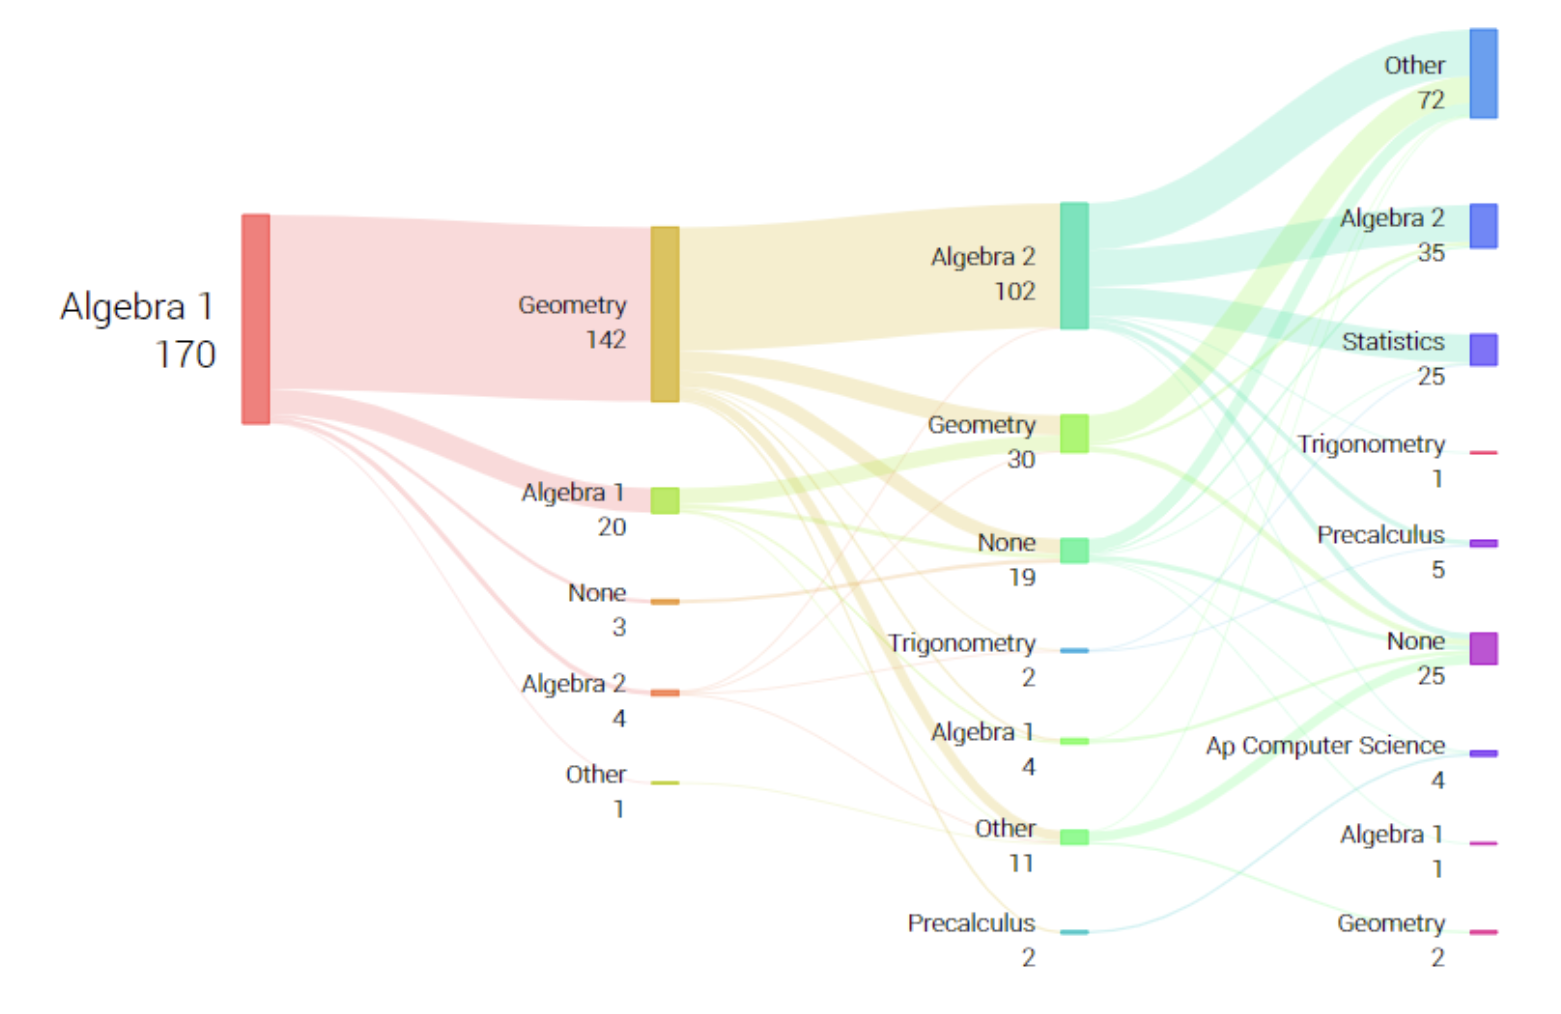
Table #4 continued
IDENTIFIED DATA TREND #3
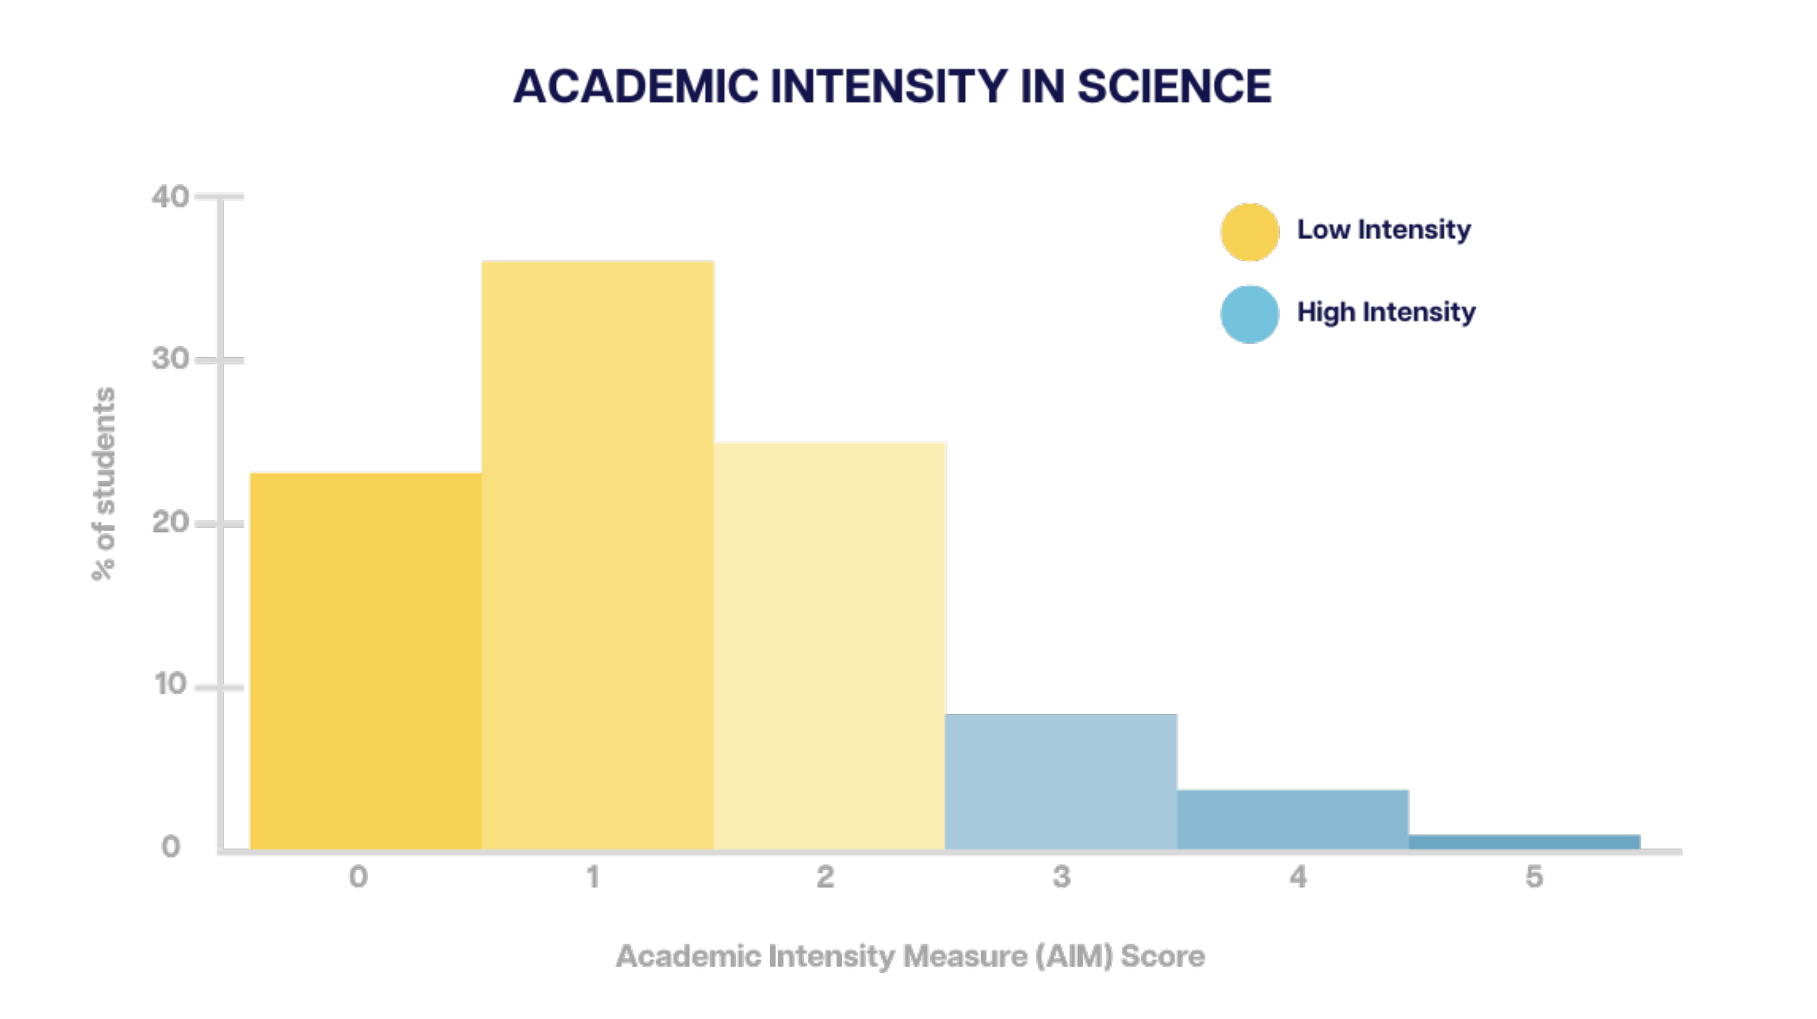
A school identified low overall science course intensity within its data.
ADDITIONAL DATA EXPLORATION
When the team examined its upper-level science offerings, it revealed there was an exceptionally large number of choices and options. As the team gathered data from students and staff members, the feedback it received was that there were two types of upper-level courses — some were perceived as being college preparatory, challenging courses, and others did not have the same perception nor did they contain the same levels of rigor or alignment to postsecondary pathways.
ROOT CAUSE ANALYSIS
A large volume of competing courses is resulting in inequitable enrollment patterns.
ABL DATA VISUALIZATION
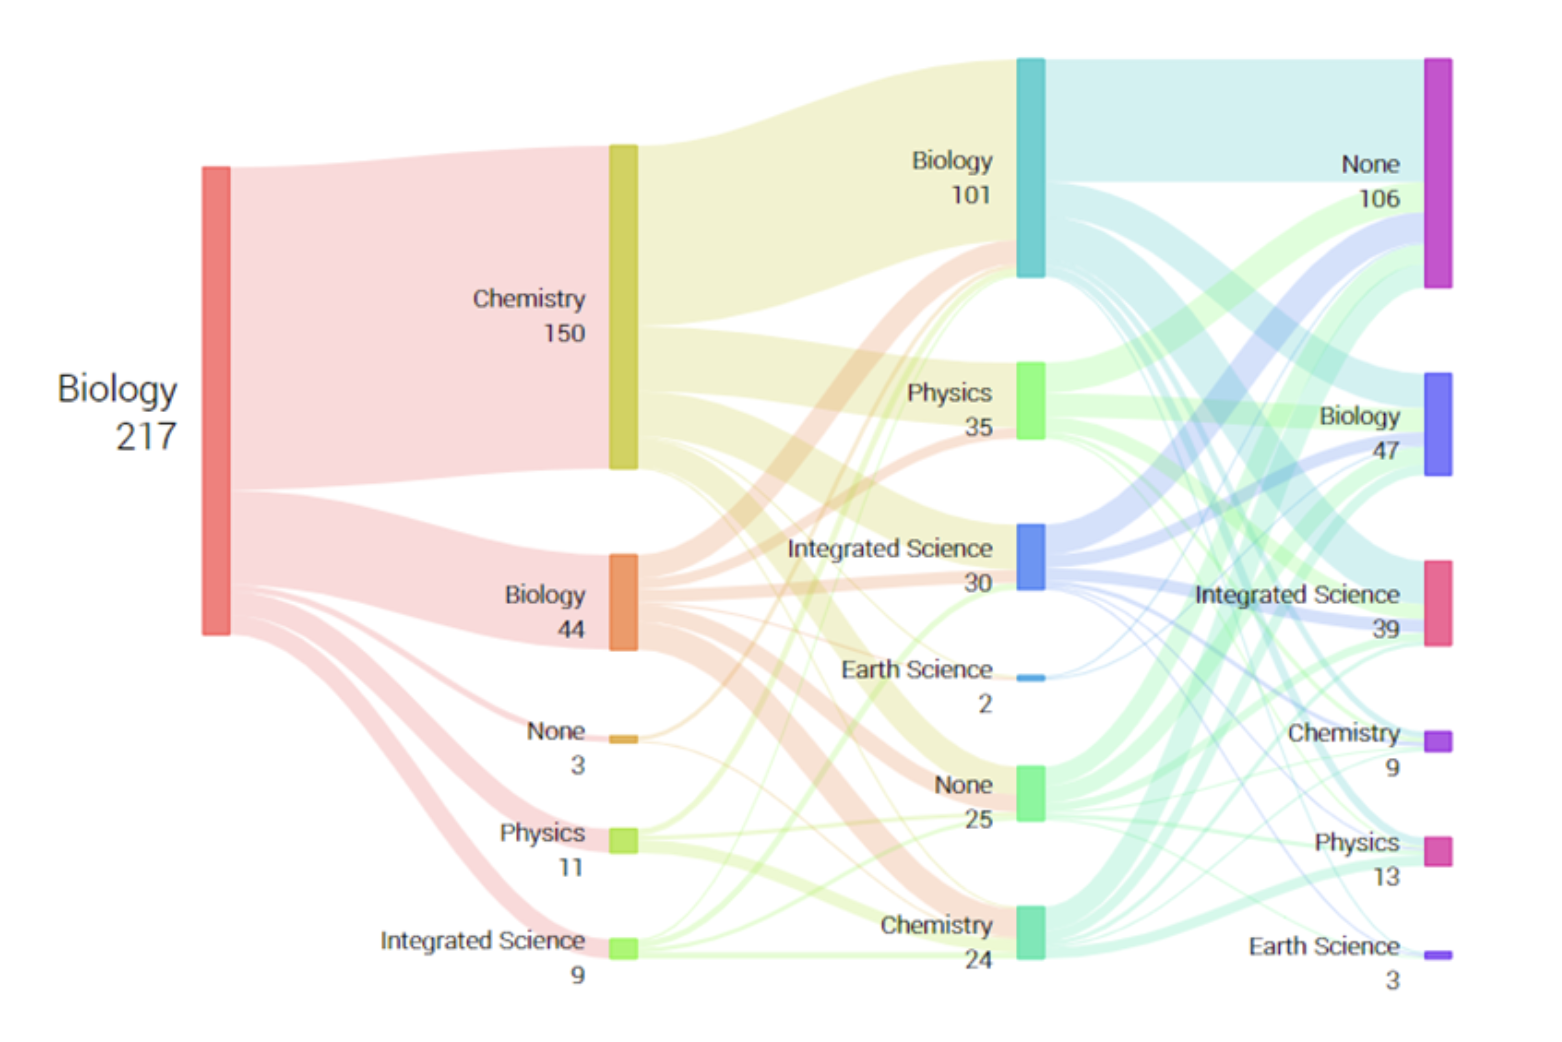
The third step involves creating a plan of action by selecting key strategies that directly address the identified root causes and trends in the data. For instance, in the last example of Table #4, the team settled upon a strategy of eliminating a number of its upper-level science courses from the course catalog and adding two additional courses. The team realized that numerous courses were not aligned with the postsecondary pathways that students pursued after high school and needed to be removed. Additionally, the school recognized that many students were pursuing careers in health science, so the team added two upper-level dual-credit courses teaching anatomy and physiology in alignment with a new CTE/science pathway.
After successfully implementing the strategies, it is critical for the school to monitor data on an ongoing basis to both ensure that the data trends change over time and the desired strategies are having the anticipated results. If the school doesn’t see changes in the data, it may be necessary to revisit the implementation strategies to ascertain whether the team made the correct assumptions regarding the data and likely root causes.
Summary
It is unlikely school leaders will make progress on their CCR goals if they are not annually using data to set goals, track progress, actively reflect on student outcomes, and adjust implementation efforts along the way. Adaptive leadership in this phase involves clearly identifying trends and challenges in the data and actively problem-solving to improve CCR for all students.
Up Next
Phase 2: Building a CCR Mindset
Addressing students’ and staff members’ mindsets is a crucial step in improving educational outcomes, especially in cases where data trends reveal low overall levels of academic intensity and postsecondary direct enrollment. By focusing on mindset development, schools and districts can create a learning environment that fosters a growth mindset among students and staff.